1. Open the service directory
From the dashboard, click + Add Monitor in the top-right of the Monitors page. You'll land in the service directory — roughly 6,000 vendors we already know how to parse, grouped by category. Use the search box to jump straight to a provider, or filter by category in the left sidebar.
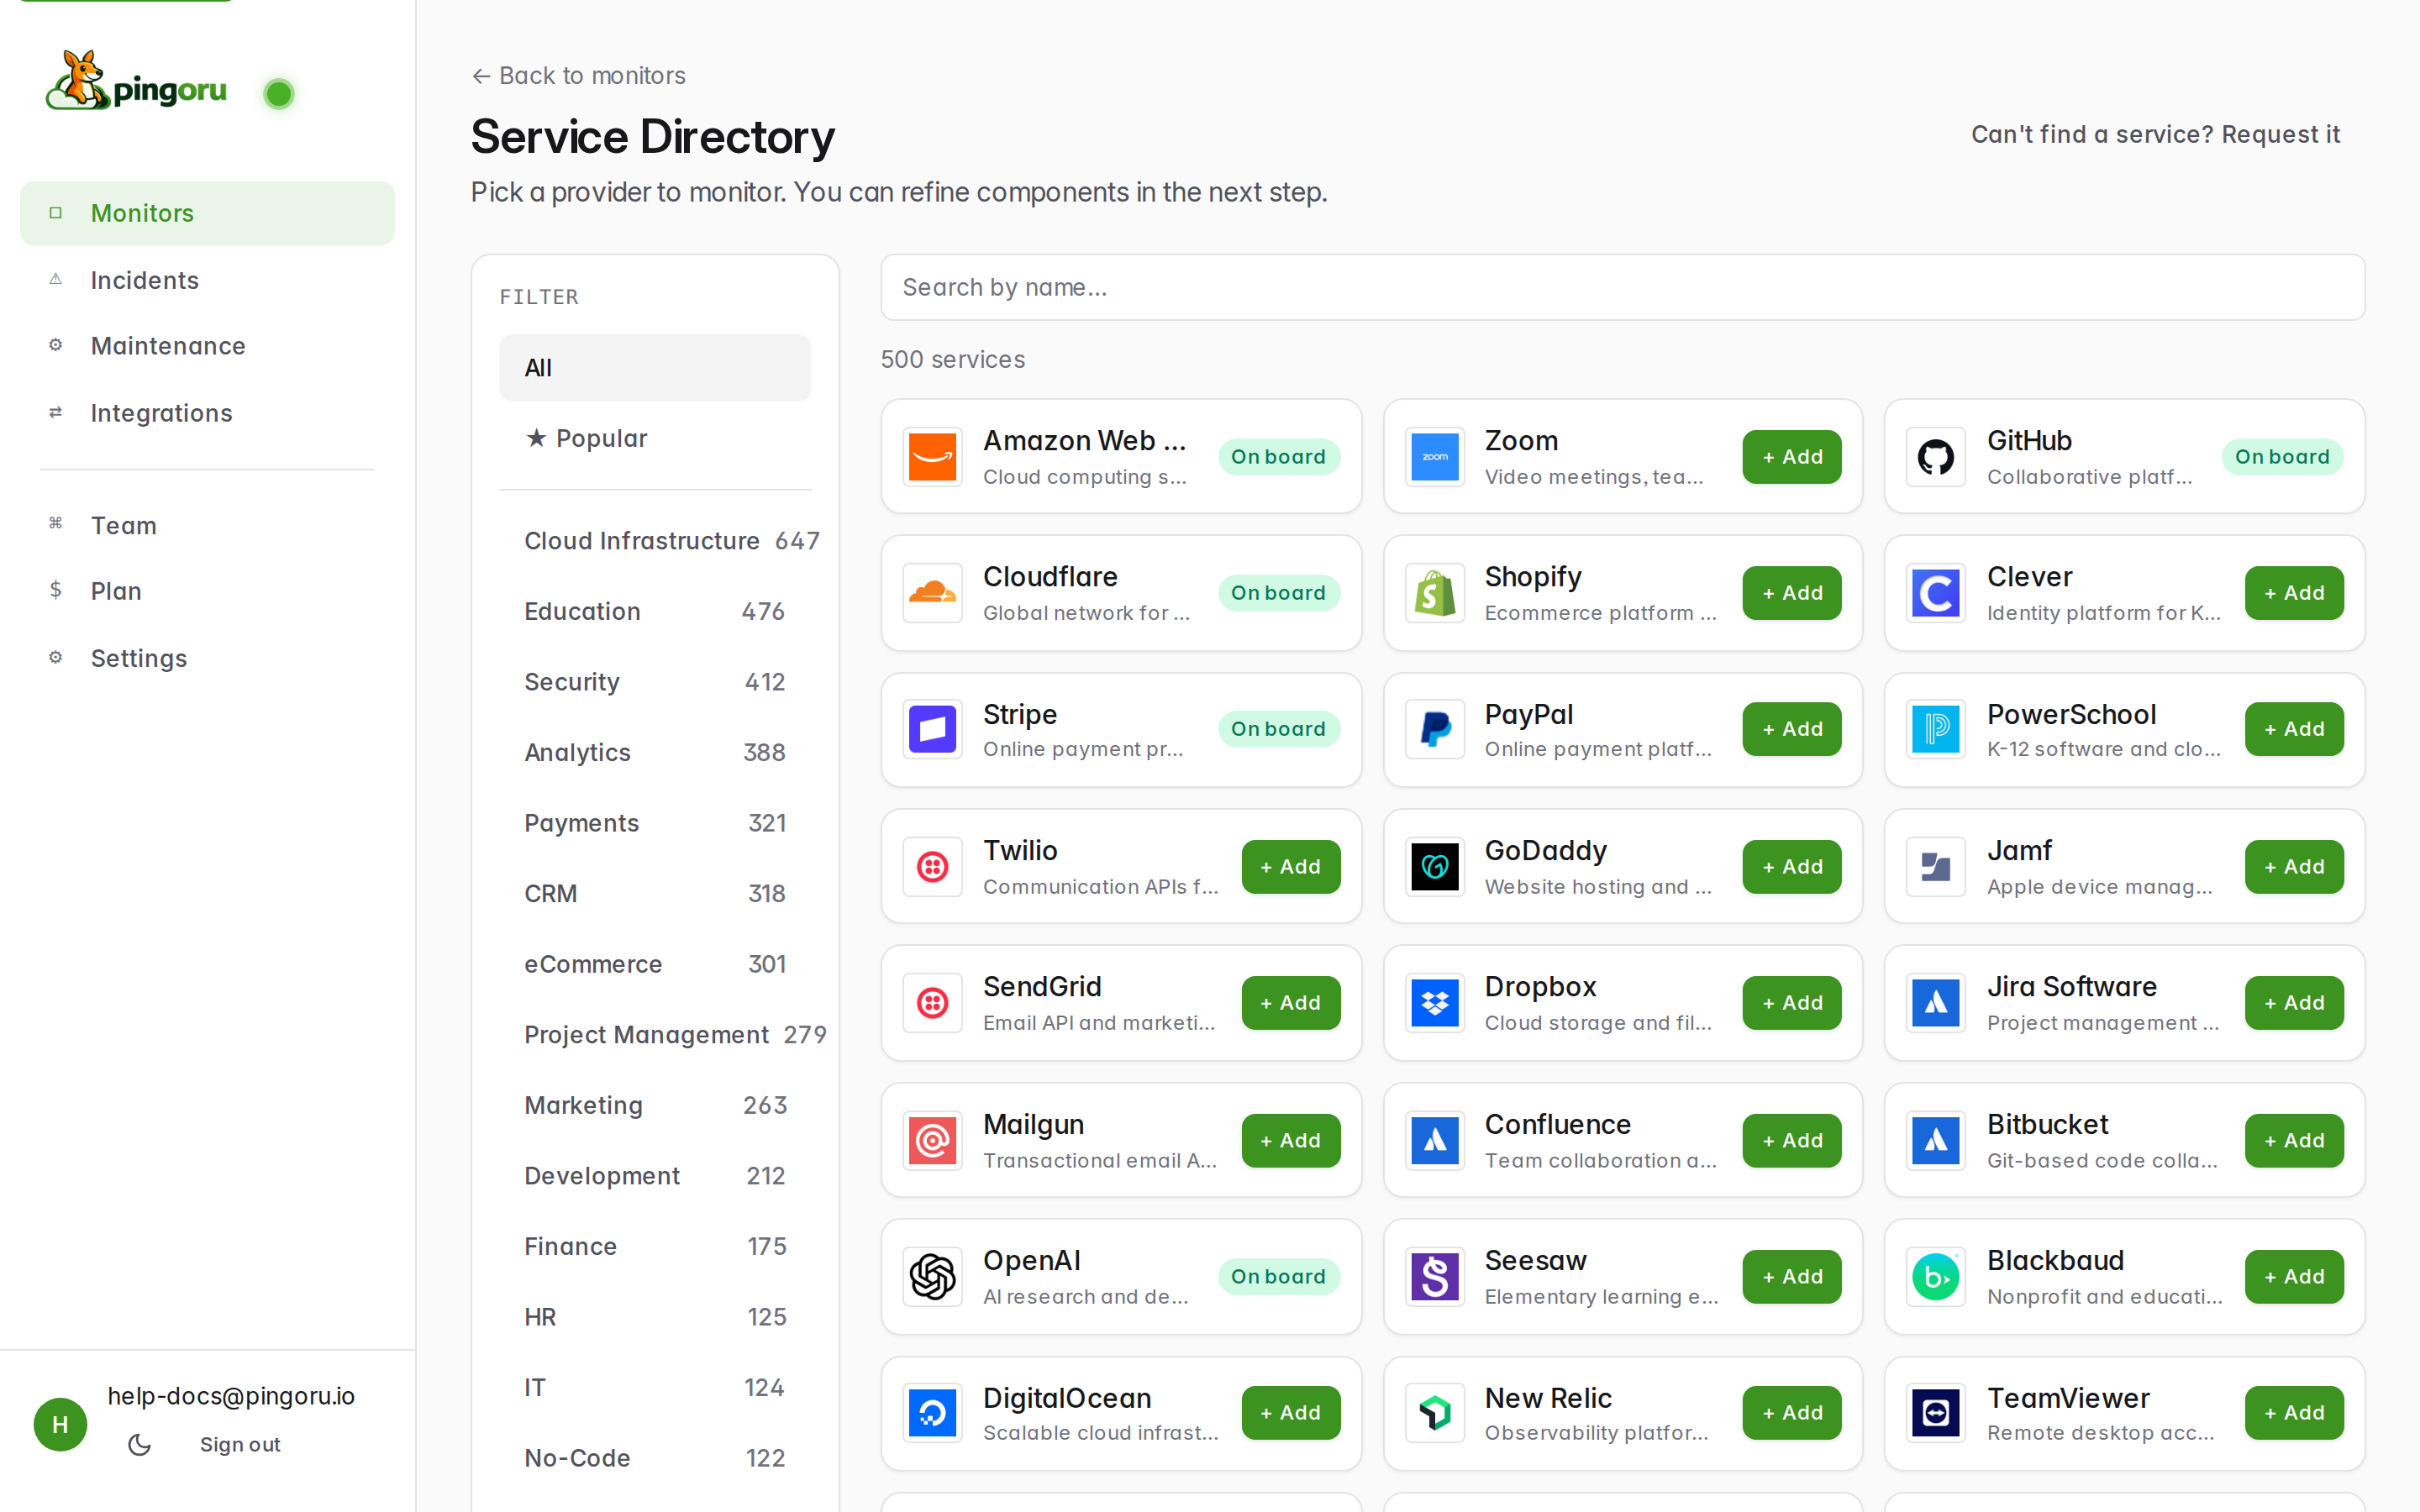
Don't see the vendor you need? Click Can't find a service? Request it in the top-right and we'll usually have it live within a few days — faster if the vendor publishes a standard machine-readable feed, slower if their page is bespoke.
2. Configure components
Click + Add on any provider and you'll land in the configure screen. This is where you decide how fine-grained you want the monitor to be.
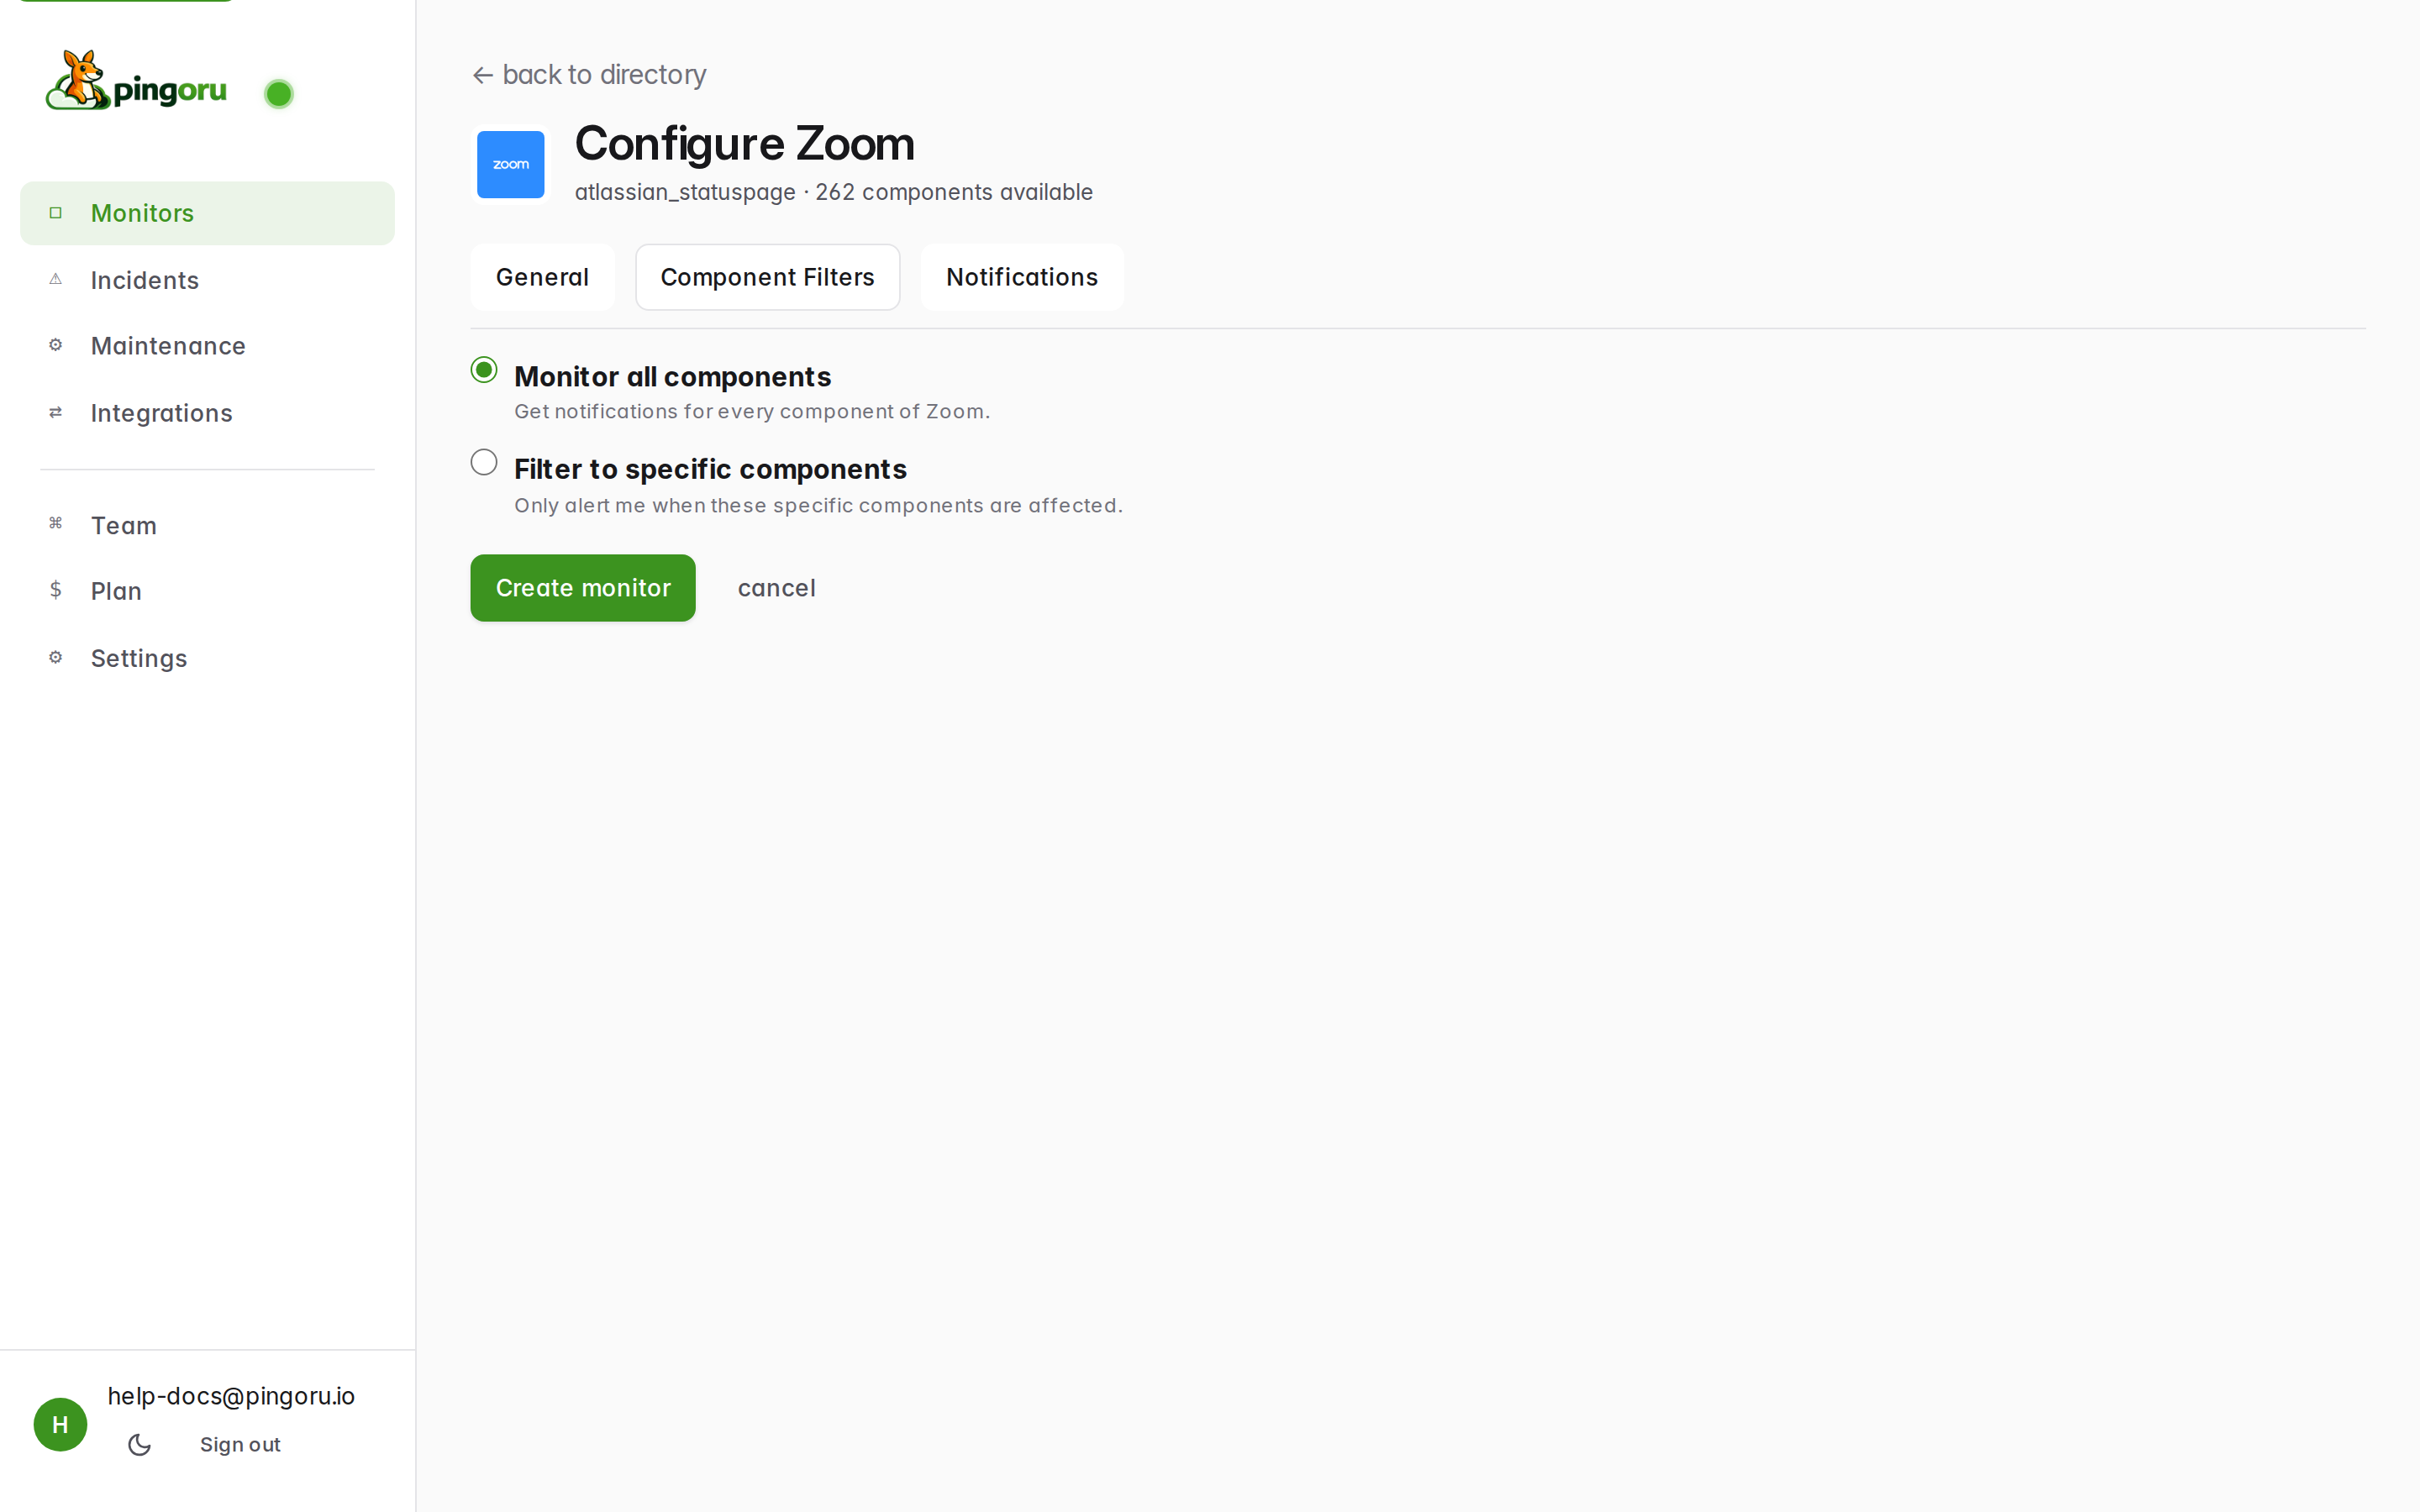
There are two modes:
- Monitor all components (the default) — you'll get alerts any time any part of the provider degrades. Best for small vendors with a handful of components (Stripe, OpenAI, Anthropic) where everything is relevant.
- Filter to specific components — narrow to the regions or
products you actually depend on. Best for cloud giants like AWS (you
probably don't care about
ap-southeast-3if your stack is all inus-east-1).
Switch to the Component Filters tab to tick exact components, or the Notifications tab to tune which event types fire an alert (see the notifications guide for the details). You can always come back and change these later.
3. Meet the monitors list
Hit Create monitor and you're back at the Monitors page. It checks every provider every 5 minutes and shows you the current state.
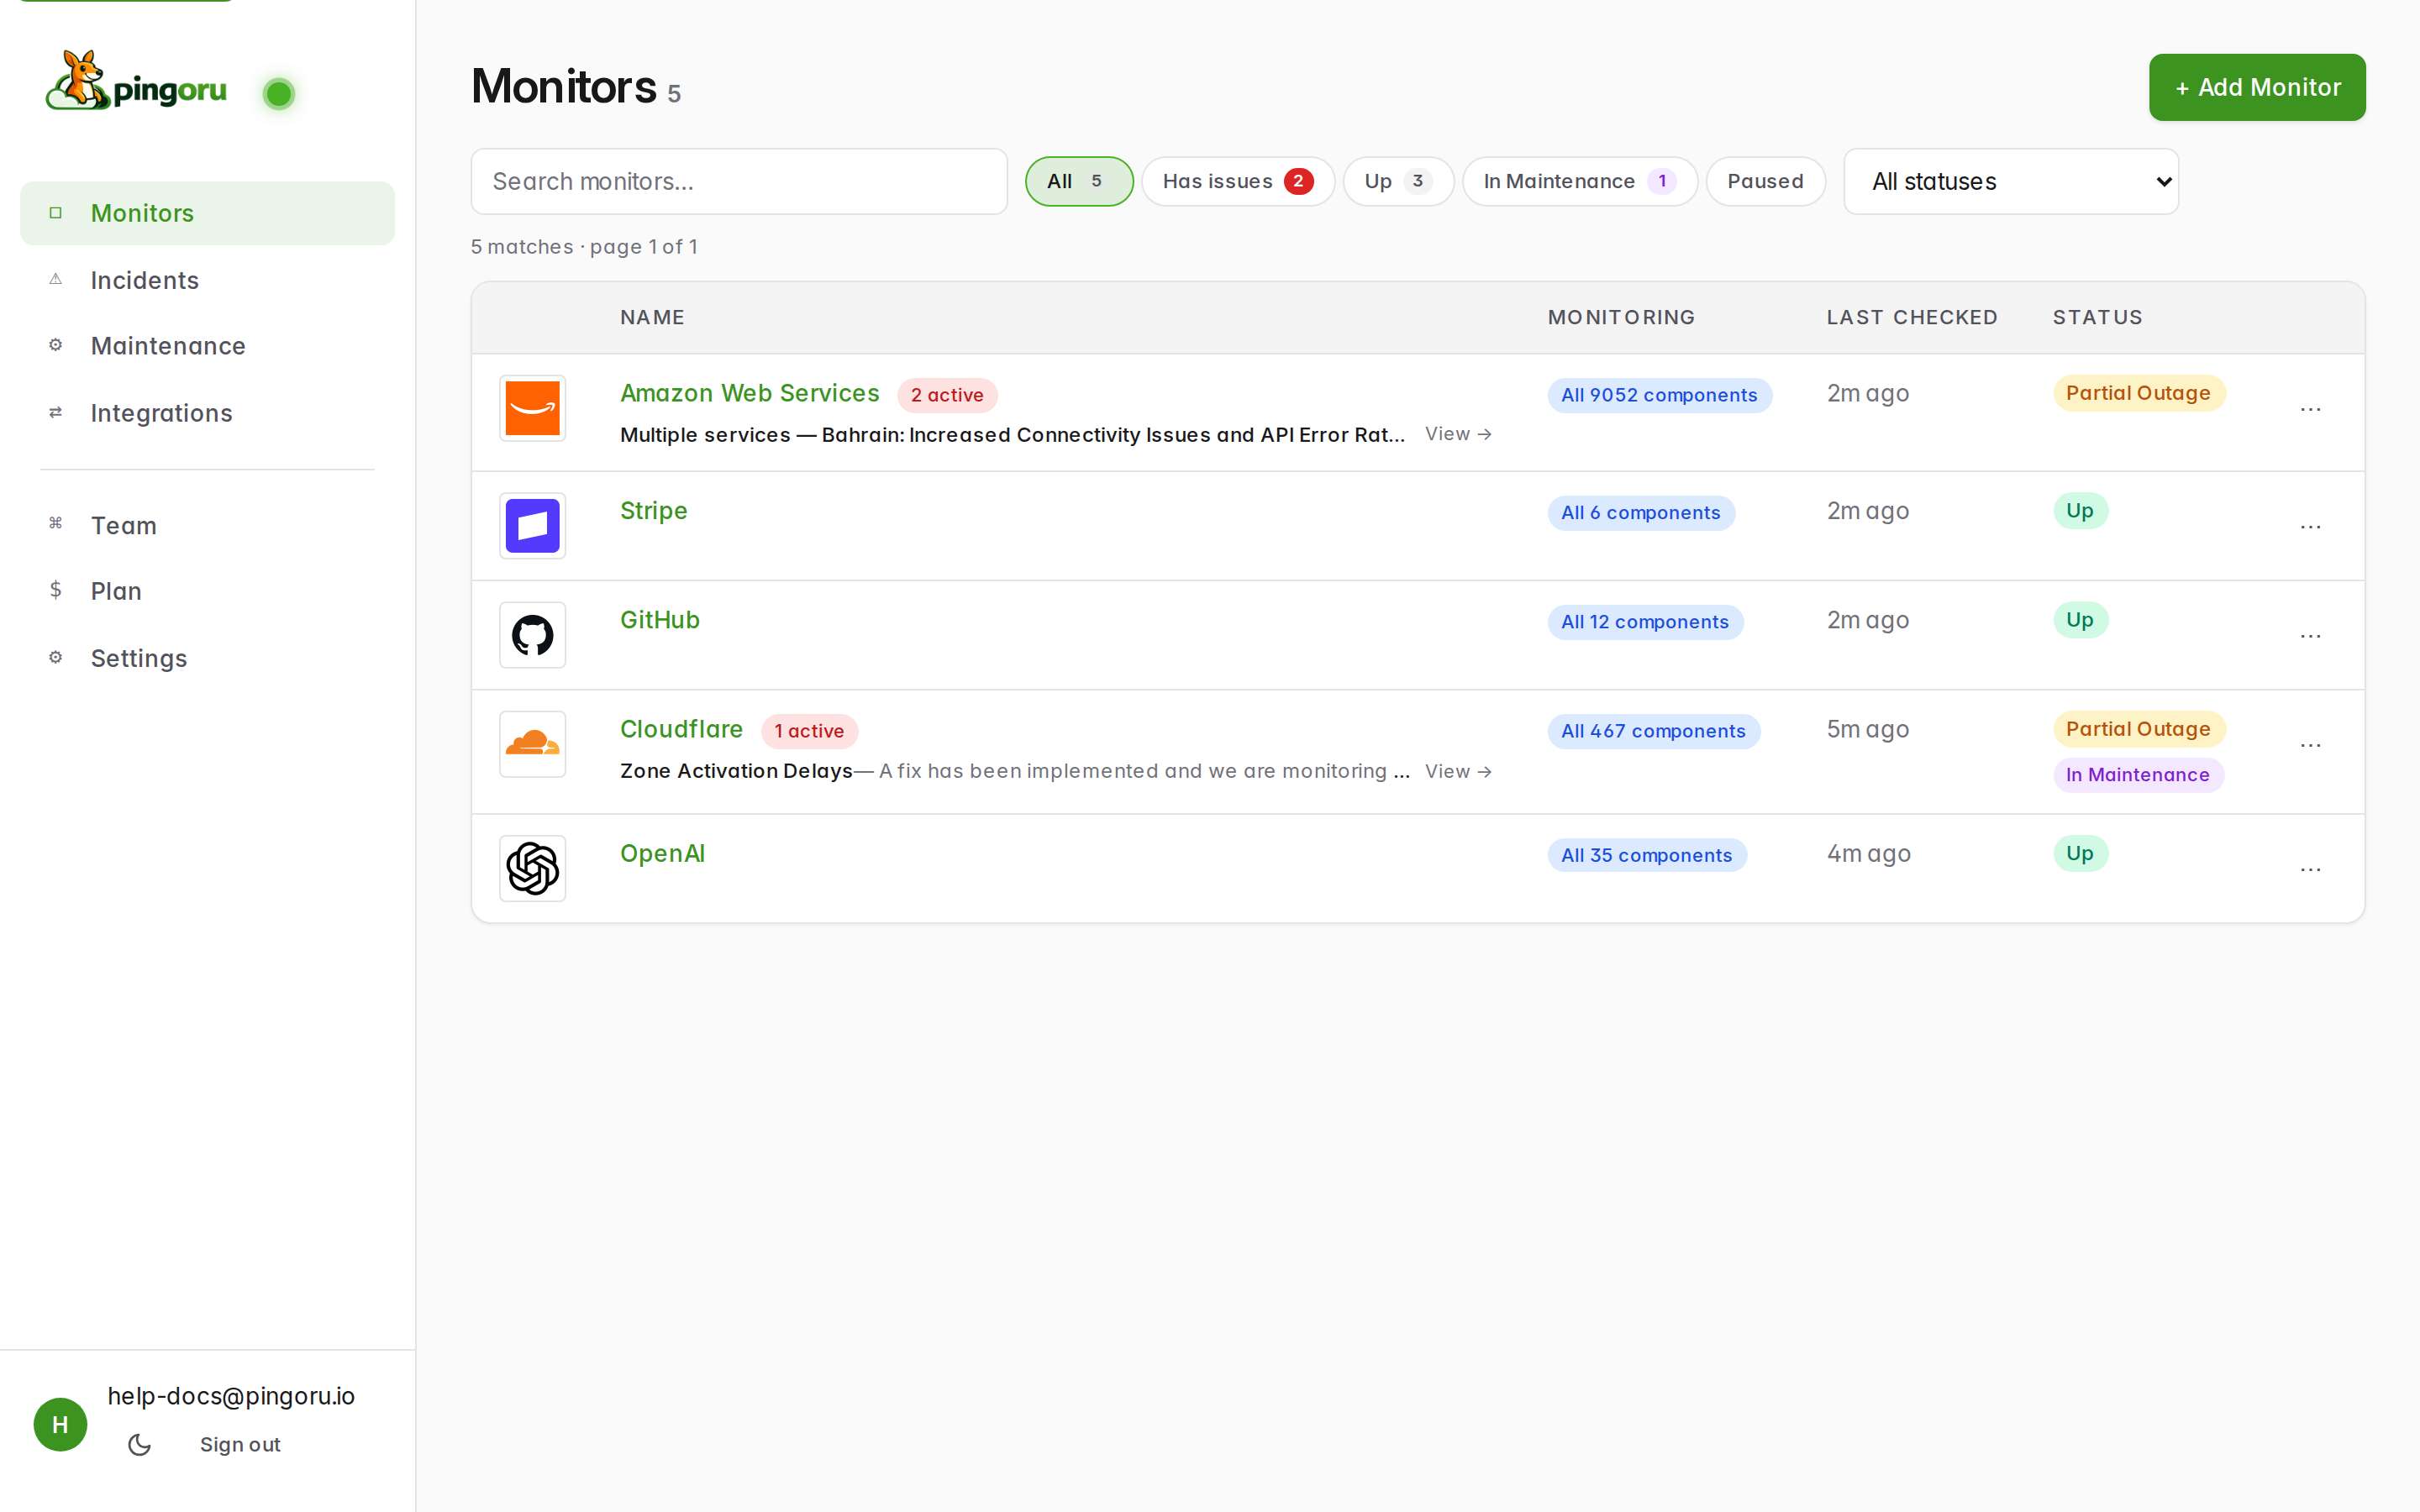
A quick tour of what you're seeing:
- Filter chips at the top: All, Has issues, Up, In Maintenance, Paused. Quick way to cut through when you have more than a handful of monitors.
- Name column shows the provider plus a small badge when there are open incidents (e.g. 2 active). The line below is the most recent incident title.
- Monitoring column tells you whether you're watching all components or a subset.
- Status pill is the worst current state across everything you're watching: Up, Degraded, Partial Outage, Major Outage. If scheduled maintenance is running right now, a separate In Maintenance chip appears alongside — maintenance doesn't make a healthy provider count as "down".
- The ⋯ menu on each row: pause alerts, jump to Components or Notifications, or delete the monitor entirely.
What's next
- Notifications — pick where alerts go (Slack / Discord / email) and which events trigger them.
- Incidents — read the feed, filter by severity, and drill into monitor history.
- Maintenance — how scheduled windows are handled, and why your "Up" provider sometimes has an extra chip.
Didn't find what you needed? Let us know — we'll add it to the guides.